Easily develop your financial forecast — from revenue to cash impact
Annual and monthly, in minutes. A guided setup wizard, integrated three-statement model, scenarios and professional Excel export — all in one place.
Set up your model in 3 guided steps
An onboarding wizard walks through your base year P&L and Balance Sheet. Guided fields, structured inputs — just type your numbers.
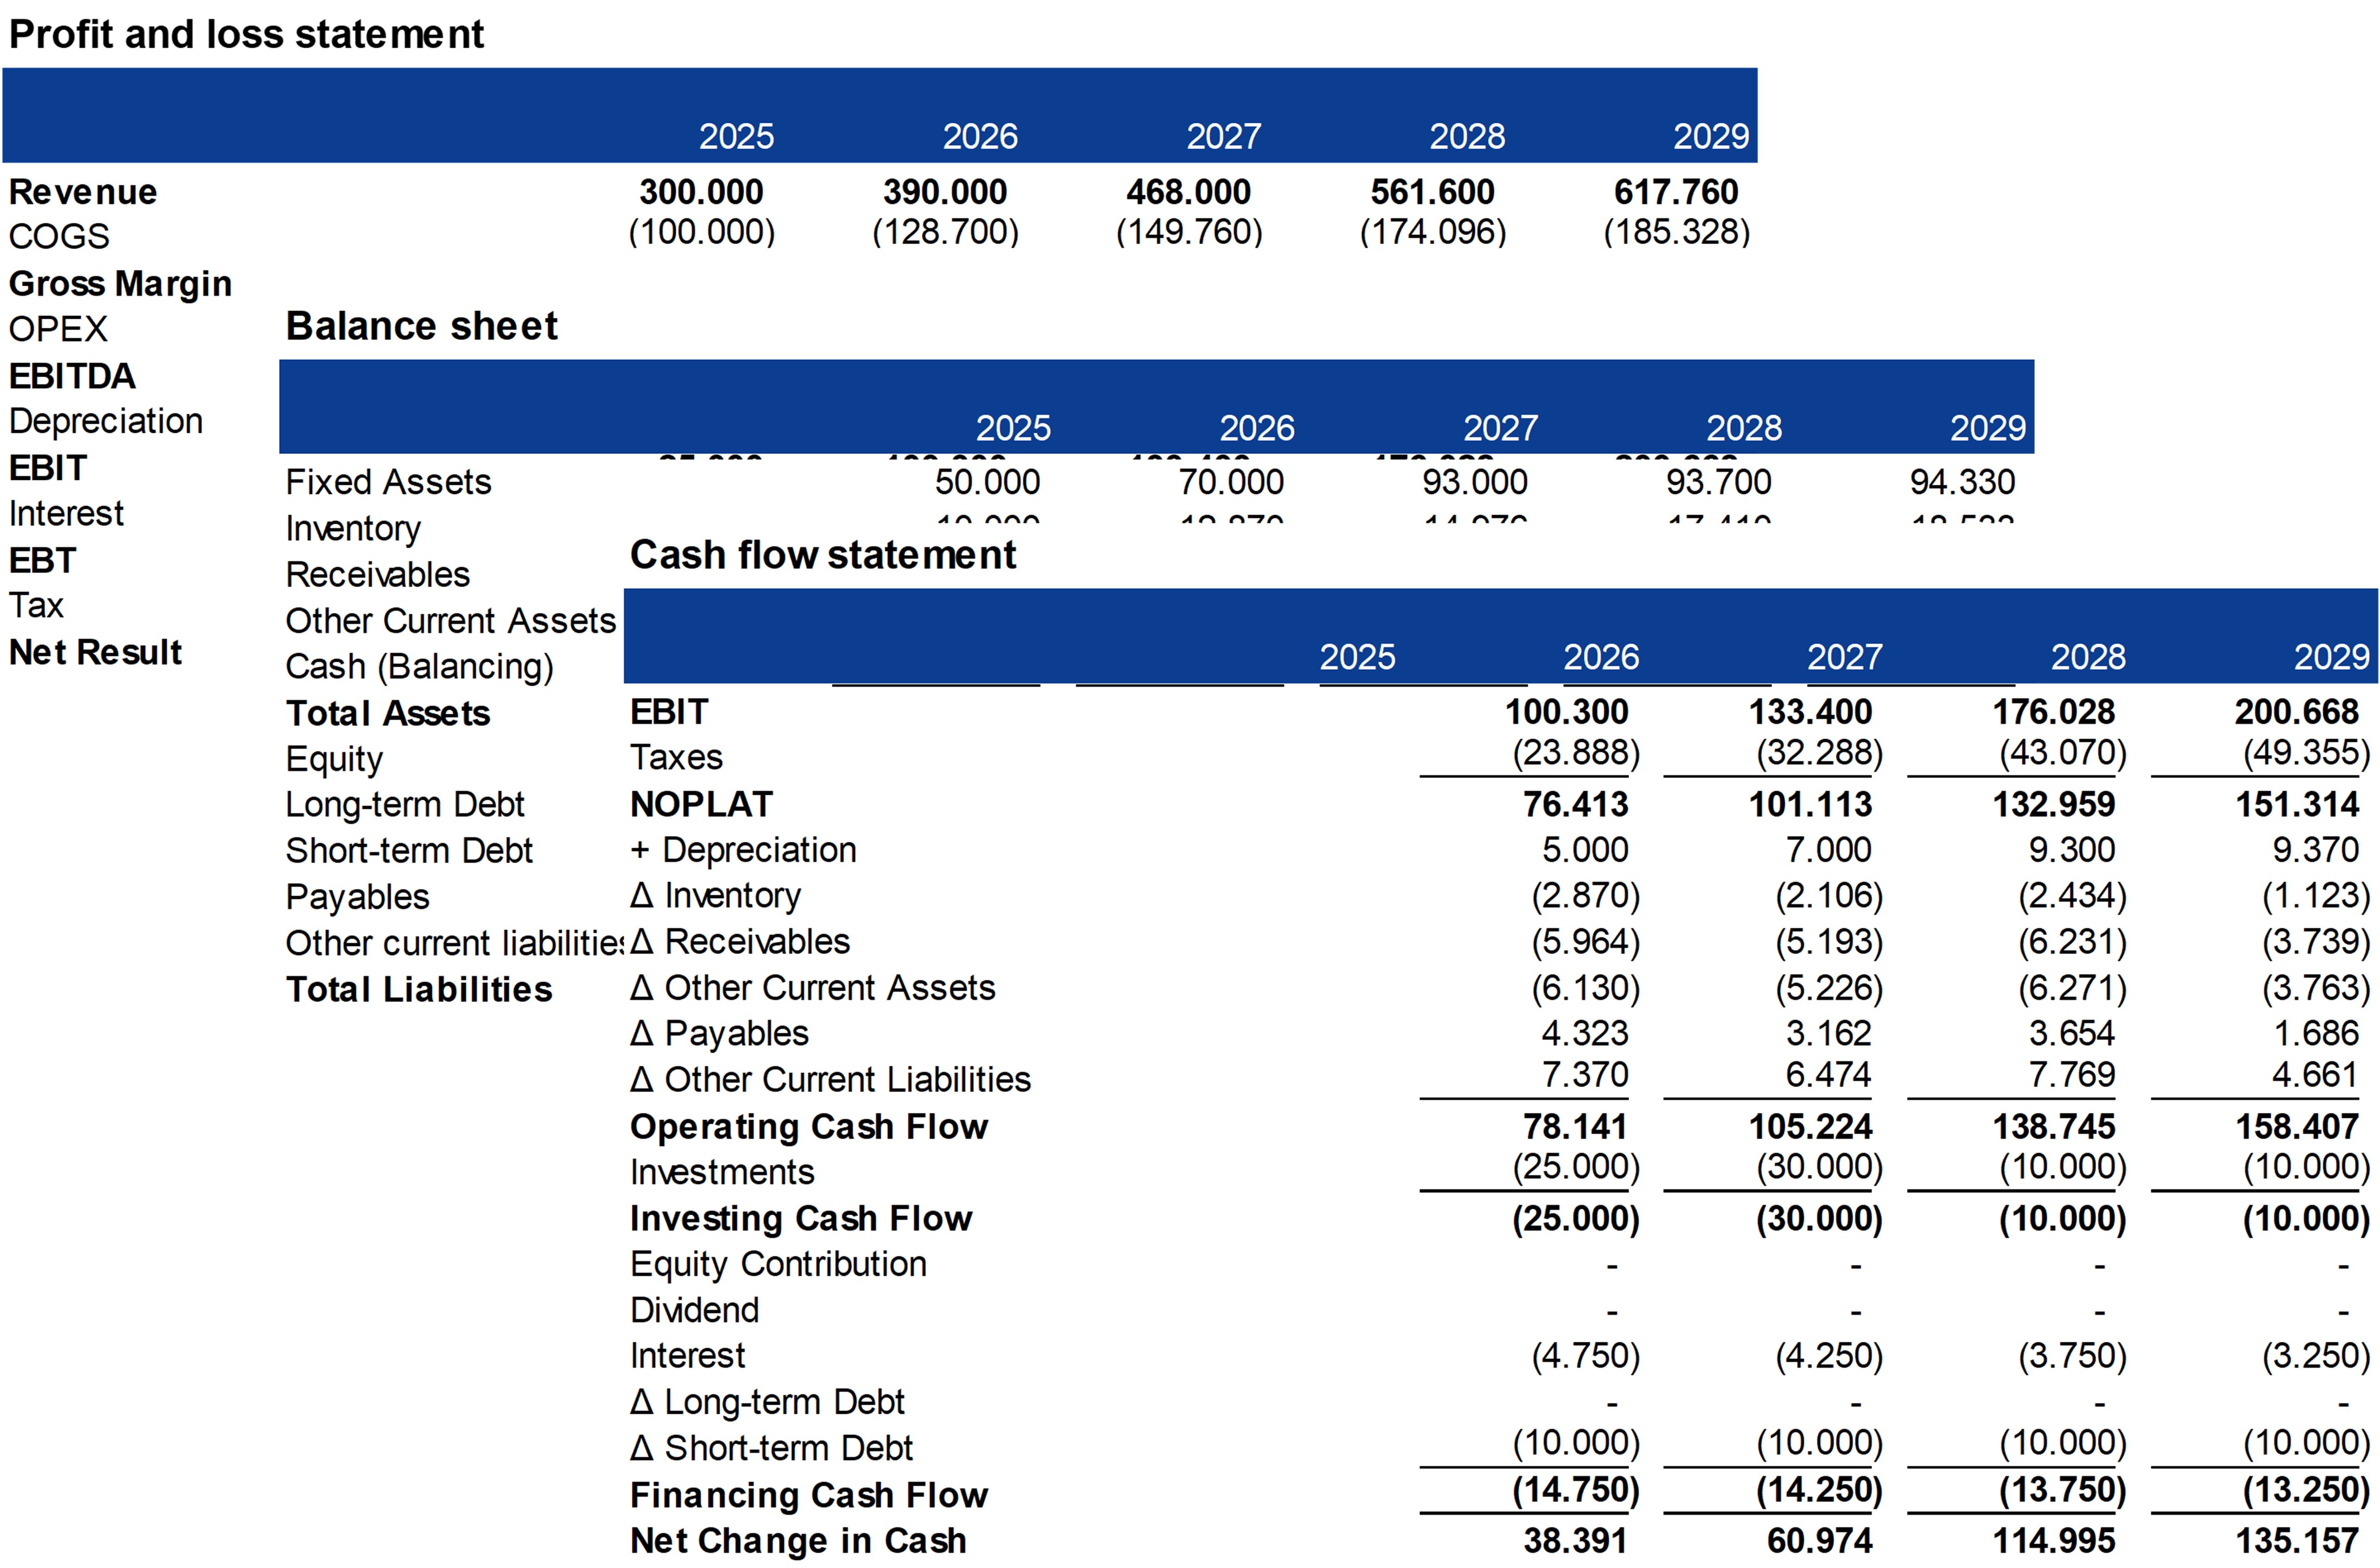
Three statements — always in sync
Set your forward assumptions. P&L, Balance Sheet and Cash Flow stay consistent as any assumption changes. No broken links, no manual reconciliation.
KPIs, ratios and model validation
The KPI dashboard shows your key financial metrics across all forecast years. Health & readiness checks run automatically — a completeness score flags missing base year inputs, and consistency checks catch balance sheet or ratio issues before you export.
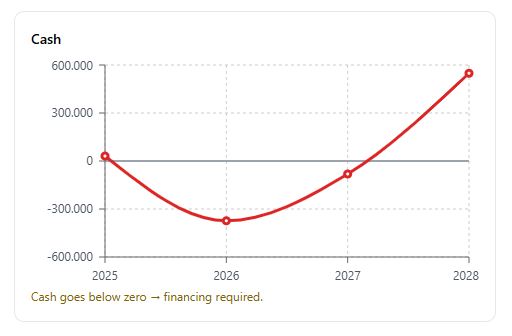
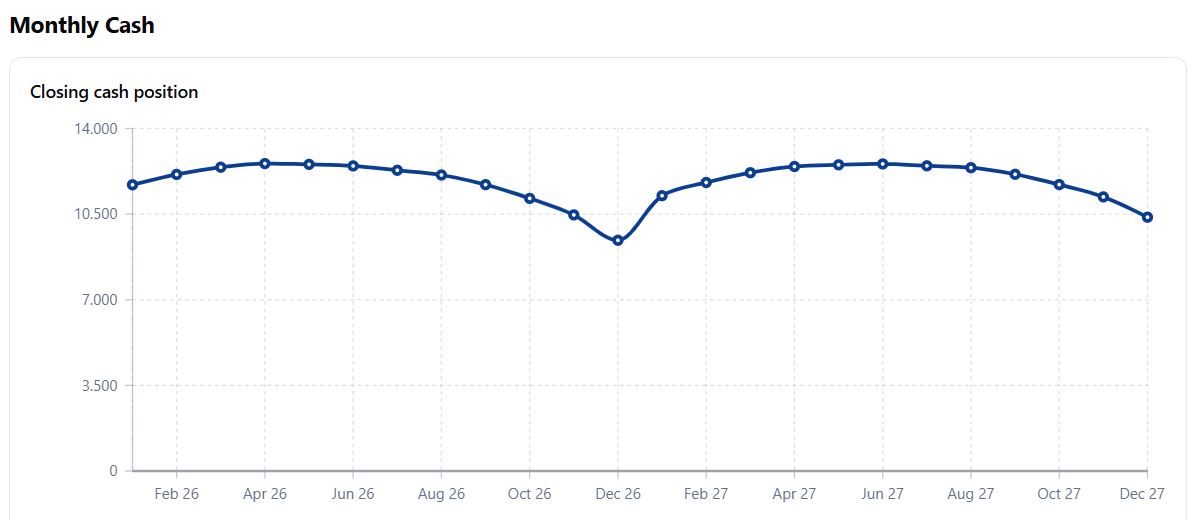
Know when cash pressure peaks — month by month
Revenue, capex and balance sheet items can be phased over the year. The monthly runway view shows where cash dips, when pressure peaks and what's driving it — so you can spot funding pressure and the timing of cash gaps well in advance.
- Full monthly cash position across the forecast horizon
- Phase revenue, capex and working capital over the year
- Distinguish timing gaps from structural funding needs
Hire timing reflected in every cash flow month
Instead of spreading annual payroll evenly at 1/12 per month, the headcount model uses your actual hire dates. A new engineer starting in May only costs from May — so your monthly cash position is accurate from day one.
- Enter FTE by role and month — changes carry forward automatically
- Monthly cost series feeds directly into the runway view
- Fully-loaded cost per FTE with annual wage inflation
- Organised by department — up to 10 departments and 5 roles each
| Role | J | F | M | A | M | J | J | A | S | O | N | D |
|---|---|---|---|---|---|---|---|---|---|---|---|---|
| Sr Engineer | 2 | 2 | 2 | 2 | 2 | 2 | 2 | 2 | 2 | 2 | 2 | 2 |
| Jr Engineer | 1 | 1 | 1 | 1 | 2 | 2 | 2 | 2 | 3 | 3 | 3 | 3 |
Blue cells = anchors you set. All other months carry forward automatically.
Management case, bank case, downside — side by side
Duplicate your base case, adjust assumptions per scenario and compare them across every year and metric. No model rebuild needed.
One click to a board-ready Excel pack
Export your full financial model to Excel in a clean, professional Big-4 style layout — annual and monthly statements, all in one file. Ready to share with your bank, board or investors without any formatting work.
- P&L, Balance Sheet and Cash Flow — annual and monthly
- Key financing ratios — leverage, interest coverage, solvency
- Scenario export — base case plus selected scenario cases
- Professional formatting — no cleanup or reformatting needed
Try it free for 5 days
Full access — no credit card. Build your model and see exactly what X-ASTRiS can do.